
Schedule Risk Analysis for Project Managers and Schedulers
Schedule risk analysis converts a deterministic critical path method (CPM) schedule into a probability-based forecast using Monte Carlo simulation. Instead of a single finish date, you get a range of possible outcomes, confidence levels attached to each one, and a ranked list of what’s actually driving the delay risk.
The process runs in three steps: prepare and validate a CPM schedule, quantify uncertainty by mapping risks and duration ranges to activities, then run thousands of simulated iterations and interpret the results.
- Prepare: Validate the CPM schedule’s logic, float, and constraints.
- Quantify: Assign three-point durations and map discrete risks from the risk register.
- Simulate: Run Monte Carlo iterations and read the P-dates, criticality index, and top risk drivers.
The outputs you’ll act on are a P50 and P80 date, a recommended time contingency, and a short list of prioritized mitigations.
Key Takeaways
Schedule risk analysis works because it converts a single deterministic finish date into a probability-based forecast that reveals both realistic contingency and the specific activities driving delay risk.
| Point | Details |
|---|---|
| SRA is probability, not prediction | It produces a range of finish dates with confidence levels, not one guaranteed answer. |
| Schedule quality comes first | A valid critical path with justified float and constraints is required before simulating. |
| P50 for planning, P80 for commitments | Use P50 internally and P80 (or higher) for dates you commit to owners or contracts. |
| Watch for merge bias | Parallel paths with high variability can control the finish date more than the critical path. |
| Update the model regularly | Rerun SRA at baseline and periodically during execution as risks and progress change. |
| Get advisory support when needed | R Construction Solutions LLC helps contractors validate CPM schedules and review SRA deliverables. |
Table of Contents
- Why Schedule Risk Analysis Matters for Project Controls
- How Does Schedule Risk Analysis Work?
- What Inputs Does a Valid Schedule Risk Assessment Need?
- Choosing the Right Modeling Approach
- How to Interpret Schedule Risk Analysis Results
- Step-by-Step Checklist for Running an SRA
- Best Practices and Pitfalls That Undermine Results
- Which Software Tools Support Schedule Risk Analysis?
- What Construction Teams Get Wrong About Schedule Risk
- Schedule Risk Analysis Deserves Better Than a Checkbox
- How R Construction Solutions Helps With Schedule Risk Governance
- Where to Learn More About Schedule Risk Analysis
- Sources
Why Schedule Risk Analysis Matters for Project Controls
A single-point CPM finish date tells you nothing about how likely that date actually is. Schedule risk analysis fixes that by attaching probability to the forecast, which is what turns a schedule into a decision-making tool instead of a wish list.
Teams that skip this step tend to size contingency by gut feel or by copying last year’s percentage. That habit shows up in the numbers: the PNNL guidance on schedule risk analysis describes SRA as the mechanism that quantifies the likelihood of on-time delivery, identifies which activities are actually driving risk, and gives contingency sizing a defensible basis instead of a guess.
Run schedule risk analysis at three points in the project lifecycle:
- Before baselining, to stress-test the plan before you commit to it.
- At major approvals or funding gates, when stakeholders need a confidence number, not just a date.
- Periodically during execution, as logic and progress data change.
The GAO Schedule Assessment Guide (GAO-16-89G) lists conducting a schedule risk analysis as one of its core best practices, and the AACE recommended practice on CPM schedule risk modeling treats it as standard procedure for any program under audit scrutiny. Citing both gives your analysis credibility with owners, auditors, and funding agencies who expect to see this work done.
How Does Schedule Risk Analysis Work?
The mechanics are simpler than the term suggests. Every credible SRA follows the same three-step arc, whether you’re running it in specialized software or overseeing a consultant who is.
- Build and validate the CPM model. The schedule needs correct predecessor and successor logic, realistic float values, and no artificial constraints propping up the finish date. A schedule with broken logic produces a Monte Carlo output that’s precise and wrong at the same time.
- Quantify uncertainty. Assign three-point estimates (optimistic, most likely, pessimistic) to activity durations, and map discrete risks from your risk register to the specific activities they threaten. This is where weather delays, permit holds, and supply chain risk get attached to real tasks instead of floating in a spreadsheet.
- Simulate and analyze. Run the Monte Carlo simulation, choosing an iteration count and sampling method, then read the resulting probability distribution, criticality index, and tornado chart. PMI’s overview of the three-step SRA approach walks through this same sequence and shows how it exposes risk that a single-path CPM view hides entirely.
Pro Tip: Run thousands of iterations using Latin Hypercube Sampling rather than simple random sampling to achieve a stable P80 tail and consistent results.
What Inputs Does a Valid Schedule Risk Assessment Need?
Garbage in, garbage out applies harder to schedule risk analysis than almost any other project control. The simulation is only as trustworthy as the schedule and data feeding it.
Start with schedule quality. A valid critical path is non-negotiable, and both the GAO Schedule Assessment Guide and AACE’s recommended practice flag the same failure points: open-ended activities, unjustified hard constraints, and float values that don’t reflect real logic. If your process improvement work hasn’t already cleaned up handoffs and dependencies, fix that before you run a single simulation.
Beyond schedule health, you need:
- Three-point duration estimates for uncertain activities, using a distribution shape (triangular, beta-PERT, or lognormal) that matches how the risk actually behaves.
- Discrete risk events from the risk register mapped to specific activities, not vague line items.
- Correlation settings between activities that share crews, weather exposure, or suppliers.
- A dated, versioned baseline with a named owner and documented evidence for every estimate.
Skipping the governance layer, meaning no owner, no dated baseline, no documented assumptions, is how an SRA becomes impossible to defend six months later when someone asks why the numbers changed.
Choosing the Right Modeling Approach
Not every risk belongs in the same bucket. Duration uncertainty (a foundation pour that might take three extra days) behaves differently than a discrete event risk (a permit denial that either happens or doesn’t), and your model needs to treat them separately to stay accurate.
- Model inherent variability with a duration range on the activity itself.
- Model discrete events (permit delays, weather windows, equipment failure) as probabilistic occurrences with their own likelihood and impact.
- Watch for correlation: shared crews, a single weather season, or one overloaded supplier can make several activities slip together. Ignoring that correlation systematically understates how bad your worst-case tail actually gets.
- Decide between a summary model for stakeholder workshops and a detailed CPM model for the analysis you’ll actually defend. AACE’s recommended practice treats this scope decision as a legitimate trade-off, not a shortcut.
Pro Tip: Start with a summary-level model in a working session with your superintendents and estimators. It surfaces the big risks fast, then you can build out the detailed CPM model to validate what the room already agreed on.
How to Interpret Schedule Risk Analysis Results
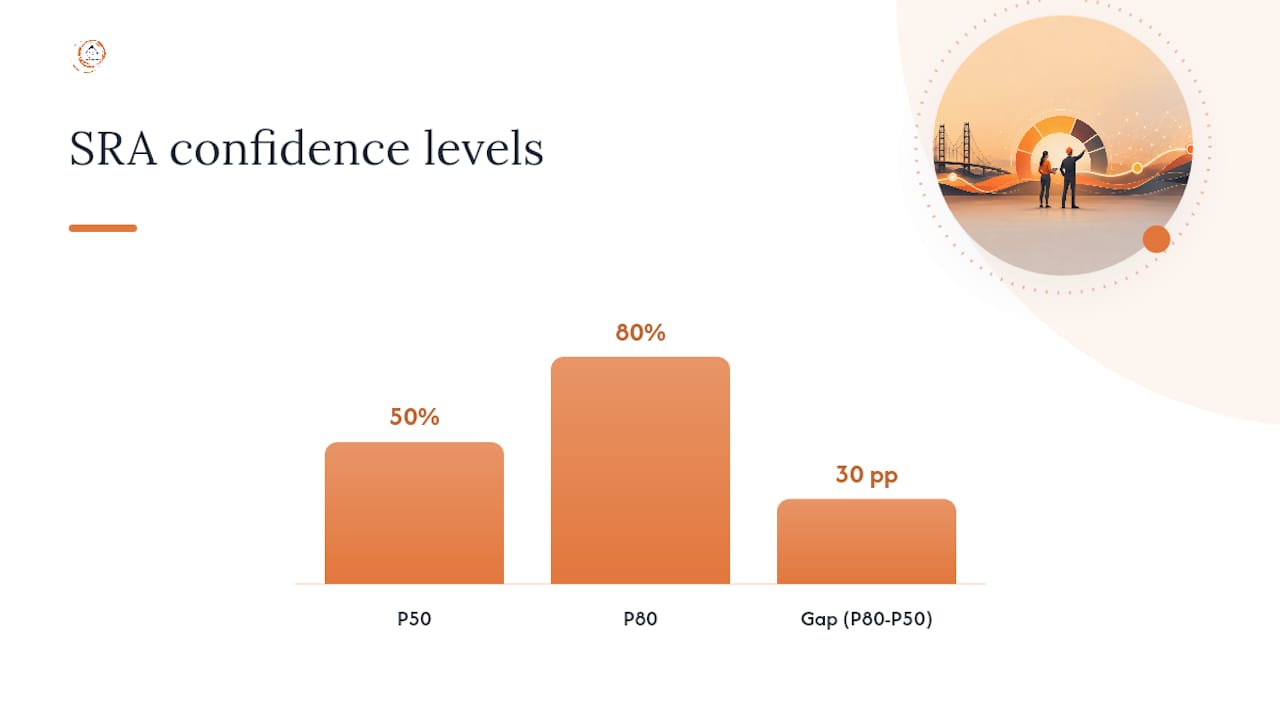
The simulation output is a probability distribution, not a single answer, and reading it correctly is what separates a useful SRA from a report nobody opens twice.
The P50 date means a 50% chance of finishing by that date, essentially a coin flip. The P80 date means an 80% chance, which is why it’s become the common construction benchmark for committed dates rather than internal planning targets. The criticality index shows how often each activity landed on the critical path across all simulation iterations, and the tornado chart ranks activities by how much their variability swings the finish date.
- Use P50 for internal planning and progress tracking.
- Use P80 (or higher, depending on owner requirements) for external commitments.
- Treat the tornado chart as your mitigation priority list: the activities at the top are where a dollar of mitigation buys the most schedule protection.
The gap between your P50 and P80 dates is your recommended time contingency, and drawing it down should follow the same governance discipline general contractors apply to cost contingency. If a simulation shows a P50 of March 1 and a P80 of March 22, that three-week spread is what you carry as buffer, and it should shrink as risks retire, not stay fixed for the life of the job.
Step-by-Step Checklist for Running an SRA
Whether you’re running the analysis yourself or reviewing a consultant’s deliverable, this sequence catches most of the mistakes that undermine results. For further guidance on leveraging modern tools and AI-assisted scheduling in construction project controls, see the Buildberry blog.
- Confirm scope and validate the baseline schedule’s logic, float, and constraints.
- Collect three-point estimates and current risk register entries with documented evidence.
- Map each risk to the specific activities it threatens, and set correlation where crews or suppliers overlap.
- Configure the simulation: iteration count, sampling method, and distribution shapes.
- Run the simulation and check for convergence, meaning the P80 tail stops moving between runs.
- Validate results with a sanity check against the schedule owner’s intuition.
- Report findings: one-line executive summary, S-curve, tornado chart, and 3 to 5 prioritized actions with owners and due dates.
Pro Tip: Lock your random seed and document every assumption before you distribute results. If a stakeholder asks you to reproduce last quarter’s numbers, you need to get the identical output, not a close approximation.
Best Practices and Pitfalls That Undermine Results
Run SRA before baselining and again at regular intervals during execution, updating three-point estimates and risk mappings as real progress data comes in. A model built once and never touched again drifts out of relevance within a few months on any active job.
The most common failure is merge bias: a shorter, higher-variability path running parallel to the critical path can end up controlling the actual finish date more than the “critical” path does. PMI’s case studies on this exact effect show how easy it is to miss when you’re only watching the longest path on paper.
- Invalid critical paths and unjustified hard constraints produce confident-looking numbers that are quietly wrong.
- Ignoring correlation between activities understates your true tail risk.
- A stale risk register feeding the model guarantees stale outputs.
A model is only as credible as the schedule underneath it. An unconstrained CPM with fabricated float will produce a Monte Carlo output that looks precise and means nothing.
Which Software Tools Support Schedule Risk Analysis?
Several platforms handle Monte Carlo simulation on CPM schedules, each with different strengths depending on your governance requirements and project scale.
- Primavera Risk Analysis (Pertmaster), from Oracle, integrates tightly with Primavera P6 schedules common on large capital programs.
- @RISK ScheduleRiskAnalysis, from Lumivero, adds simulation capability on top of existing schedule files with strong correlation modeling.
- Deltek Acumen Risk focuses on schedule health diagnostics alongside simulation.
- RiskyProject offers a more accessible entry point for teams building their first probabilistic models.
- Excel-based PERT or Monte Carlo add-ins work fine for prototyping a summary model before committing to dedicated software.
Prioritize convergence control, correlation handling, and audit logging over flashy visuals. This list isn’t exhaustive, and naming a tool here isn’t an endorsement. Choose based on your governance needs and the scale of the programs you run.
What Construction Teams Get Wrong About Schedule Risk
Construction schedules carry risk patterns that generic project templates miss entirely. Seasonality, long-lead equipment orders, and permit timelines all behave more like discrete events than smooth duration ranges, and modeling them as simple three-point estimates understates how binary they actually are.
- Model seasonality (concrete pours, roofing, exterior work) as a probability distribution tied to calendar windows, not a flat duration.
- Treat long-lead items and permit approvals as discrete risk events with their own probability of delay.
- Integrate subcontractor schedules into the integrated master schedule so trade stacking and handoff fragility show up in the simulation, not just in hindsight.
- Set your target confidence level to match contract language: plan internally at P50, commit externally at P80, unless the owner’s contract specifies otherwise.
Most construction schedules fail at simulation not because the math is wrong, but because the risk register was never truly connected to the activities that carry it.
Rowena Tulacz, founder of R Construction Solutions LLC, brings more than 30 years of construction operations and advisory experience to this kind of schedule governance work, though her role has always been strategic and operational rather than field-based.
Schedule Risk Analysis Deserves Better Than a Checkbox
The conventional advice treats schedule risk analysis as a compliance exercise: run the simulation once, generate a P80 date, attach it to the proposal, move on. That approach wastes most of what the technique is actually good for.
The real value isn’t the date. It’s the ranked list of risk drivers that tells you exactly where a dollar of mitigation buys the most protection. A contractor who runs SRA once at baseline and never again is holding a snapshot of risk that was accurate the day it was taken and increasingly wrong every week after.
What I’d prioritize differently: treat the risk register and the schedule model as one connected system that gets updated together, not two documents maintained by different people on different schedules. Most of the “surprise” delays I’ve seen in growth-stage contracting firms were visible in the risk register for months before they hit the critical path. The simulation didn’t fail. Nobody rebuilt it after the risk register changed.
Start smaller and more often, rather than bigger and less frequently. A rough summary-model SRA run monthly beats a perfect detailed model run once.
How R Construction Solutions Helps With Schedule Risk Governance
Running a defensible schedule risk analysis takes more than software. It takes a schedule clean enough to trust, a risk register that’s actually connected to activities, and a governance process for updating both as the job moves. R Construction Solutions LLC works with growth-stage contractors to build that foundation: validating CPM logic, setting up three-point estimating conventions, and establishing the update cadence that keeps a P80 number meaningful past the day it’s generated.

We’re not a certified WBE, DBE, or MBE firm, and we don’t position ourselves as one. What we offer is direct advisory experience: three decades of operations and business development work inside the construction industry, applied to your specific schedule and risk register. If you’re preparing to bid a job that requires probabilistic schedule commitments, or you have an SRA deliverable from a consultant that needs an independent review, our construction consulting services team can walk through it with you. Reach out to get a second set of eyes on your next schedule risk model before you commit to a P80 date you can’t defend.
Where to Learn More About Schedule Risk Analysis
For deeper methodology and governance standards, consult the primary sources this article draws from directly.
- GAO Schedule Assessment Guide (GAO-16-89G) for audit-grade governance and best-practice checklists.
- AACE recommended practice RP 64R-11 for CPM modeling methodology and scope decisions.
- PNNL’s schedule risk analysis overview for a concise technical summary.
- PMI’s schedule risk analysis primer for the three-step approach and merge bias case studies.
- Recent academic work on risk interaction networks for advanced sensitivity modeling.
Sources
- GAO Schedule Assessment Guide (GAO-16-89G)
- Schedule risk analysis | PNNL
- AACE recommended practice: CPM schedule risk modeling and analysis (RP 64R-11)
- Schedule risk analysis simplified | PMI