90 Day Project Profitability Plan for Contractors
Improving project profitability comes down to five operational controls: selective bidding, accurate estimating, real-time job costing, enforced change-order billing, and rolling cash forecasts tied to progress billing. Firms that lose margin almost always fail at one of these, not at “strategy.” This article covers the metrics that catch problems early, the tactics that stop margin loss during delivery, the systems that make those tactics repeatable, and a 90-day plan to put it all in motion.
TL;DR:
- Most firms lose margin due to operational failures such as untracked change requests, delayed timesheets, and resource switching, rather than poor strategy.
- Key KPIs like gross margin, net margin, PPI, utilization, and WIP movement must be reviewed regularly to catch problems early and prevent late-stage margin erosion.
- Accurate project profitability calculation requires consistent data on recognized revenue, direct costs, overhead, and committed but unbilled expenses, with monthly PPI reviews to identify reconciliation errors.
- Implementing automated, integrated systems for job costing, change order processing, and real-time alerts is essential to maintaining reliable data and enabling quick corrective actions.
- Focusing first on operational discipline, such as daily cost tracking and weekly reviews, is more effective than solely relying on estimating improvements for long-term profit stability.
Table of Contents
- What Project Profitability Means and Which KPIs to Track
- How to Calculate Project Profitability Step by Step
- Why Profitability Problems Surface Too Late
- Practical Strategies to Protect Margins During Delivery
- Which Tools Make These Tactics Repeatable?
- What Should a Job Profitability Report Include?
- Benchmarks and Realistic Targets for Improvement
- Implementation Roadmap: Your 30/60/90-Day Plan
- How R. Construction Solutions Implements These Controls
- What Most Advice on Project Profitability Gets Wrong
- Get Help Turning These Controls Into Practice
- Sources
- FAQ
What Project Profitability Means and Which KPIs to Track
Project profitability is what remains after every direct cost, allocated overhead, and non-billable hour tied to a job is subtracted from what the client actually pays. Revenue tells you what came in. Profitability tells you what you kept. A $2 million contract that clears $2.1 million in revenue after change orders but bleeds labor overruns and untracked rework can still lose money. Revenue growth without margin discipline is a vanity number.
You need a handful of KPIs reviewed on a fixed schedule, not once at closeout.
- Gross margin: revenue minus direct job costs, divided by revenue. This is your first checkpoint on whether a job is priced and running correctly.
- Net margin: gross margin minus allocated overhead. This is the number that actually funds growth.
- Project Profitability Index (PPI): net profit divided by total costs. CFMA recommends reviewing PPI monthly so trends surface before they become losses.
- ROI: net profit divided by total investment, useful for comparing capital-intensive jobs against each other.
- Realization rate: billed hours or amounts against what was actually planned or worked, exposing scope drift.
- Utilization: percentage of paid time spent on billable work, a direct signal of labor efficiency.
- WIP movement: the gap between billed-to-date and earned revenue, an early flag for over- or under-billing.
- DSO (days sales outstanding): how long cash takes to arrive after invoicing, which affects your ability to fund the next phase.
A PPI trending downward for two consecutive months, before the job even closes, is the earliest reliable warning sign most firms have available.
How to Calculate Project Profitability Step by Step
Calculating project profitability accurately requires five inputs, gathered consistently across every job: recognized revenue to date, direct costs (labor, materials, subcontracts), allocated overhead, non-billable time tied to the project, and committed costs not yet invoiced (open purchase orders, subcontract commitments).
Follow this sequence for every active project:
- Pull recognized revenue based on percentage of completion or billed milestones, not contract value.
- Total direct costs actually incurred, including labor at loaded rates, not base wages.
- Add committed but unbilled costs so you’re not flattered by a gap in vendor invoicing.
- Calculate gross margin: (Revenue − Direct Costs) ÷ Revenue.
- Subtract allocated overhead to get net margin.
- Calculate PPI: Net Profit ÷ Total Costs, and compare against the prior month’s figure.
- Reconcile against your original estimate to isolate variance by category (labor, material, subcontract, change order).
Pro Tip: Run this calculation against committed costs, not just paid invoices. A subcontractor who hasn’t billed you yet still owes you a cost on the books, and skipping it is the single most common way project managers overstate margin mid-job.
The most common data trap is mixing loaded and unloaded labor rates within the same calculation. If your estimate assumed a $65 fully loaded rate and your actuals report base pay only, every job will look more profitable than it is, right up until overhead reconciliation exposes the gap. A second trap: treating retainage as collected revenue when it’s still held back, which artificially inflates realization rate. CFMA’s guidance on financial health metrics points to monthly PPI reviews specifically because monthly cadence catches these reconciliation errors before they compound across a quarter.
Why Profitability Problems Surface Too Late
Margin erosion is rarely a single bad decision. It’s usually four operational failures compounding quietly over weeks.
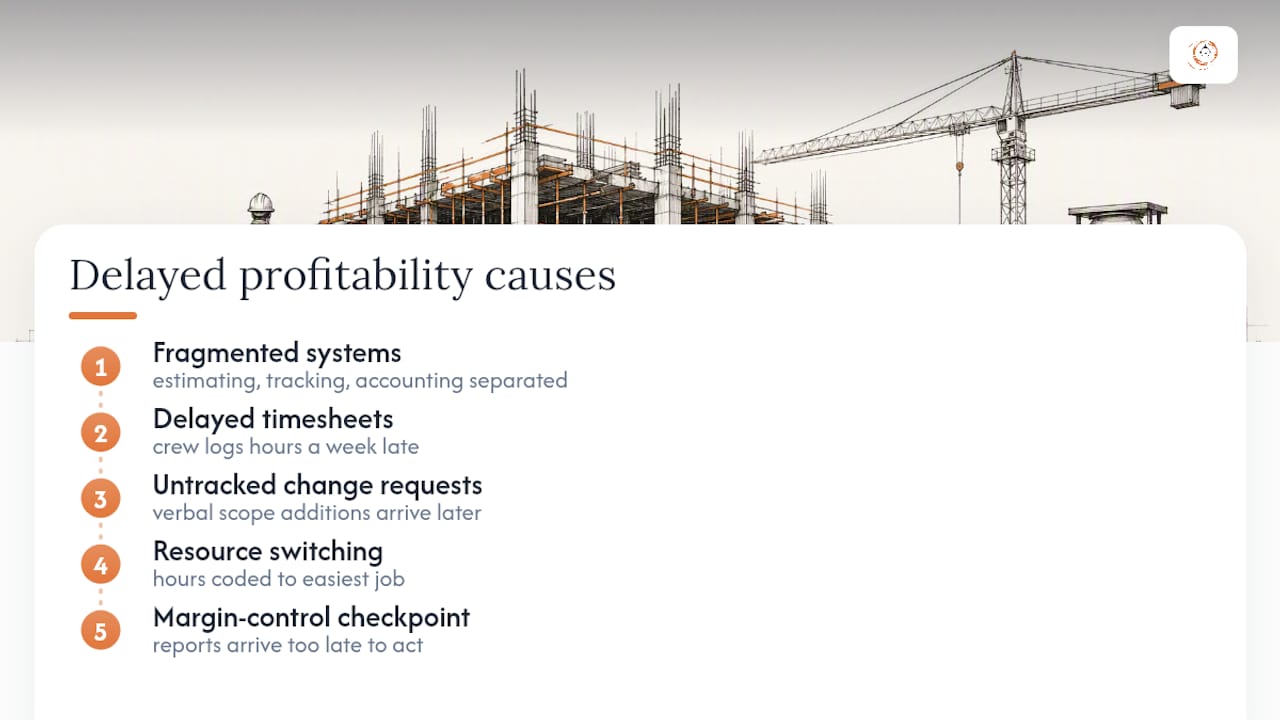
Fragmented systems are the root cause behind most of the rest. When estimating lives in one spreadsheet, time tracking in another, and accounting in a third system that syncs once a month, nobody sees the full financial picture of a job until it’s too late to correct it.
Delayed timesheets make labor costing worse. A crew that logs hours a week after the fact means your job-costing report is always describing last week’s job, not this week’s. By the time an overrun shows up in the numbers, the labor is already spent.
Untracked change requests are the quiet killer. Field teams agree to “small” scope additions verbally, work proceeds, and the paperwork (if it happens at all) arrives weeks later, disconnected from billing. Automating change-order intake and tying it directly to billing is one of the highest-leverage fixes available, because forecast accuracy depends on knowing scope changes the moment they happen.
Resource switching adds a final layer of leakage. When a superintendent gets pulled to a different job mid-week, the hours often get coded to whichever job is easiest to bill, not the job that actually consumed the time.
Pro Tip: If your job-costing reports are more than a week behind field activity, you are managing the previous project, not the current one.
Practical Strategies to Protect Margins During Delivery
Fixing profitability mid-project requires discipline in six specific areas, applied in this order of impact.
- Bid selectively. Build a fit checklist covering crew availability, historical margin on similar work, client payment history, and geographic overhead before submitting any bid. A hollow backlog of low-margin jobs accepted to keep crews busy erodes overall profitability faster than a slower quarter with fewer, better-fit contracts, which is why utilizing expert Construction SEO Services can help you prove it and win more bids. If your estimating team can’t say no to a bad-fit job, they don’t have the authority they need.
- Fix estimating before fixing execution. A structured estimating checklist that pulls historical cost data and applies a realistic contingency, rather than a flat percentage, closes most of the gap between estimate and actual before the job even starts.
- Run job costing daily or weekly, not monthly. Capture costs as they happen, reconcile against budget every week, and escalate any category more than 10% off plan immediately rather than at the next scheduled review.
- Govern change orders formally. Every scope change gets a written intake form, a cost and schedule impact estimate, and client sign-off before work proceeds. Align documentation with AIA billing formats so change orders flow directly into your next application for payment instead of sitting in a folder.
- Optimize resource allocation. Set utilization targets by role, track labor drift weekly, and require documented approval before pulling a resource off one job to cover another.
- Adjust billing and pricing tactics. Negotiate retention percentages down where possible, align your progress-billing schedule to actual cash outlay rather than calendar months, and offer modest early-pay incentives to clients with a history of slow payment.
Pro Tip: Treat your estimating process as a living document. Every closed job should feed corrected cost data back into your estimating templates within a week, not at year-end. Firms that skip this step keep repeating the same estimating errors project after project.
A construction bid automation approach that scores incoming opportunities against your fit checklist automatically removes the temptation to chase every lead regardless of margin potential.
Which Tools Make These Tactics Repeatable?
Tactics only work if the systems behind them capture the right data automatically, rather than depending on someone remembering to update a spreadsheet.
Your job-costing system needs to capture labor hours, material costs, subcontract commitments, and change orders in one place, integrated with time capture, procurement, and accounts payable/receivable. If those systems don’t talk to each other, someone is manually re-entering data, and that’s where delays and errors creep in.
- Mobile clock-in/clock-out tools attribute labor costs to the correct job code the moment the hour is worked, not a week later.
- Integrated change-order workflows should push approved changes directly into your billing application, aligned with AIA-style formats, so nothing gets stuck between field approval and invoice.
- Rolling forecasts, refreshed monthly or on a 13-week cycle, pull in real labor and material data rather than relying on the original bid assumptions months after they stopped being accurate.
- Predictive alerts flag a job the moment utilization drops or committed costs spike, instead of waiting for the monthly close to reveal a problem that started weeks earlier.
On the ERP-versus-point-solution question: smaller firms doing under $5 million in annual revenue often do fine stitching together a job-costing tool and a lightweight CRM. Firms scaling past that point typically find the integration gaps between separate systems start costing more in manual reconciliation time than a consolidated ERP platform would cost in licensing. Real-time financial data materially improves how quickly problems get caught, which is the entire argument for consolidating rather than patching together five disconnected tools.
What Should a Job Profitability Report Include?
A job profitability report functions as a job-level income statement: it should show revenue recognized, billed-to-date, work-in-progress balance, committed costs, open change orders, and variance against the original estimate, all on one page per project.
- Revenue recognized to date versus contract value
- Billed-to-date versus earned revenue (the WIP gap)
- Committed costs not yet invoiced
- Open and pending change orders with dollar impact
- Variance by cost category against the original estimate
Review cadence matters as much as report content. Project managers should walk through their own job’s report weekly, with finance joining a shared review every two weeks to catch cross-project patterns a single PM might miss.
| Trigger | What it usually signals | Action |
|---|---|---|
| PPI turns negative or drops two months running | Cost overrun or under-billing | Escalate to ownership within the week |
| WIP surges beyond normal range | Billing lagging behind work performed | Accelerate invoicing, review billing schedule |
| Utilization dips below target | Resource switching or idle crew time | Reassign labor, review scheduling |
| Change orders pending over two weeks | Broken intake or approval process | Audit change-order workflow immediately |
These triggers work because they’re specific and measurable, not vague prompts to “check in” on a job.
Benchmarks and Realistic Targets for Improvement
Published industry ranges give you a starting point, not a scorecard to hit blindly. According to Project Metrics Hub’s benchmark data, median gross profit margin across contractors runs 18% to 22%, median net profit margin sits at 3% to 5%, and median operating profit margin lands between 5% and 8%.
| Metric | Typical benchmark range | What to watch |
|---|---|---|
| Gross margin | 18% to 22% | Sustained drop below range signals estimating or cost-control issues |
| Net margin | 3% to 5% | Persistent low end suggests overhead is outpacing revenue growth |
| Operating margin | 5% to 8% | Wide swings quarter to quarter point to inconsistent job selection |
Benchmarks are directional, not a ceiling or floor to chase mechanically. A firm doing complex, high-risk commercial work should expect thinner margins than one running repeatable residential remodels, and comparing the two against the same target band is a mistake. Track your own trend line over four to six quarters before deciding whether a single low month is noise or a real problem, and set escalation thresholds (a full percentage point below your own historical average, for instance) rather than reacting to every month-to-month wobble.
Implementation Roadmap: Your 30/60/90-Day Plan
You don’t need a full system overhaul to start seeing results. Sequence the work.
- Days 1 to 30: Enforce a daily timesheet submission rule with no exceptions, roll out a standardized estimating checklist across every new bid, and start a weekly WIP review meeting with PMs and finance.
- Days 31 to 60: Implement a formal change-order intake and approval workflow tied directly to your billing cycle, adjust your progress-billing schedule to match actual cash outlay, and stand up your first rolling 13-week cash forecast.
- Days 61 to 90: Integrate job costing with time capture and procurement into a single reporting view, configure automated alerts for utilization and PPI thresholds, and launch a shared PM and finance KPI dashboard reviewed weekly.
Skipping the sequence, jumping straight to automated dashboards before your underlying data capture is reliable, just automates bad numbers faster.
How R. Construction Solutions Implements These Controls
Rowena Tulacz has spent more than 30 years in construction operations, business development, and executive advisory work, with direct experience implementing job-costing discipline and project management systems including Procore and Buildertrend. R Construction Solutions LLC brings that background to estimating support, process improvement, PM system implementation, and federal procurement consulting for contracting firms scaling past ad-hoc operations.
Outcomes vary by firm size, current systems, and how disciplined the team is about adopting new workflows. R Construction Solutions LLC does not hold WBE, DBE, or MBE certification, and every engagement runs under a signed engagement letter with a scoped set of deliverables rather than open-ended promises.
What Most Advice on Project Profitability Gets Wrong
Most profitability advice treats margin as something you discover at closeout, a report card you read after the grade is already locked in. That framing is backwards. Profitability is a live signal, not a postmortem, and firms that only look at it monthly are always reacting to decisions made weeks earlier.
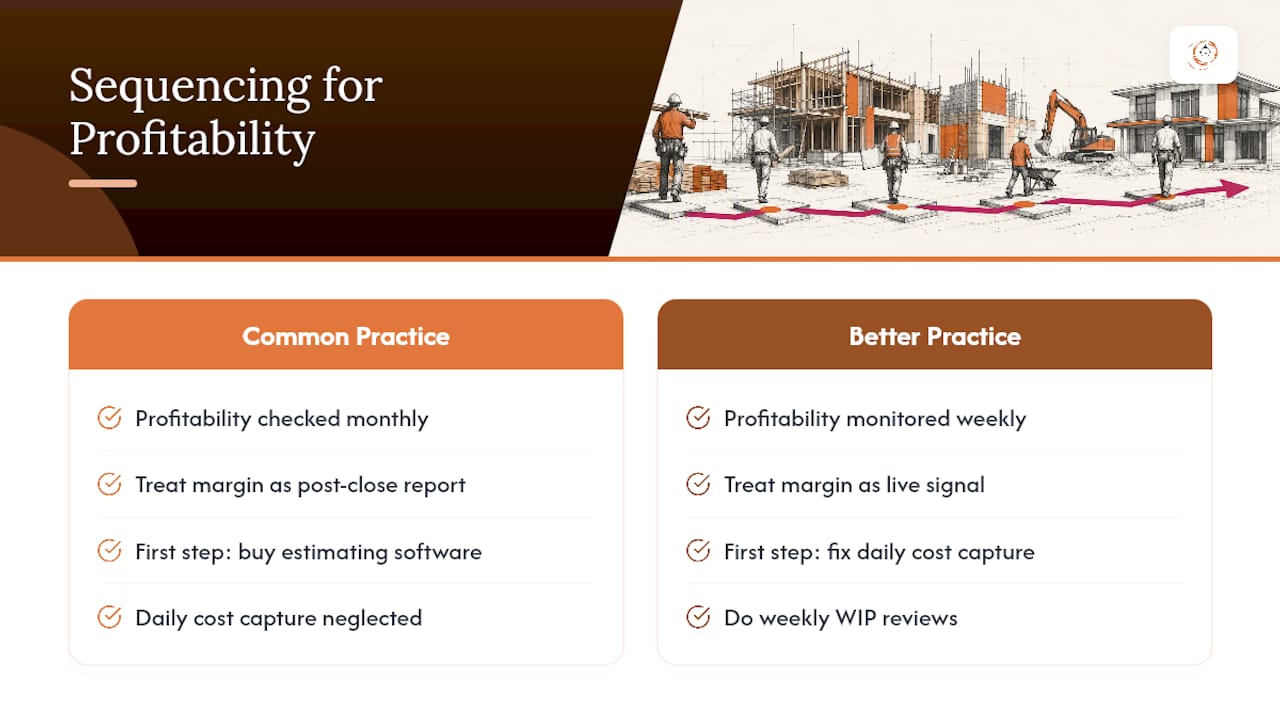
The conventional advice to “estimate better” isn’t wrong, but it’s incomplete on its own. A perfect estimate still erodes if change orders go untracked and timesheets lag a week behind the field. I’d argue the sequencing most firms use is backwards: they chase better estimating software before they’ve fixed the basic discipline of daily cost capture and weekly WIP review. Fix the operational cadence first. The tools matter less than whether someone is actually looking at the numbers every week and acting on what they see.
If you take one thing from this: PPI and realization rate matter more than gross margin alone, because they tell you whether a job is trending the wrong direction while there’s still time to intervene.
— Rowena Tulacz
Get Help Turning These Controls Into Practice
Reading a 90-day checklist is one thing. Building the estimating templates, change-order workflow, and job-costing cadence that actually stick inside your business is another. R Construction Solutions LLC works specifically with growth-stage contractors, generally doing $1 million to $10 million in annual revenue, who have outgrown spreadsheets but haven’t yet built the financial controls a larger firm runs on.

A typical engagement starts with an operational assessment covering estimating accuracy, job-costing practices, and current systems, followed by a scoped proposal and hands-on implementation, whether that’s building an estimating checklist, integrating a PM platform, or setting up change-order governance tied to billing. Services include estimating support and bid preparation, process improvement and workflow optimization, and CRM or PM system implementation such as Procore, Buildertrend, or HighLevel CRM. Visit the construction consulting services page to schedule an initial assessment and get a scoped proposal for your firm.
Sources
- Construction’s lifeline: key metrics for measuring financial health
- Job profitability report
- 2026 Construction Financial Benchmarks — Project Metrics Hub
FAQ
How Can Project Profitability Be Improved?
Improve project profitability by bidding selectively, tightening estimate accuracy, running job costing weekly instead of monthly, enforcing change-order billing, and using rolling cash forecasts to catch overruns while there’s still time to correct them.
What Is the 80/20 Rule for Project Managers?
Applied to profitability, the 80/20 rule means roughly 20% of your projects, cost categories, or clients typically drive 80% of your margin problems, so job profitability reports should prioritize flagging that small set of high-risk jobs rather than treating every project equally.
What Are the 5 P’s of Profitability?
Definitions of the “5 P’s” vary across industries and sources, and no single version is standard for construction profitability specifically; focus instead on the measurable KPIs covered in this article, like gross margin, PPI, and realization rate.
How Do You Measure Project Success Beyond Revenue?
Measure project success through net margin, PPI, realization rate, and whether the job’s WIP balance stayed aligned with billing throughout delivery, not just whether total revenue hit the contract value.
Can Better Estimating Alone Fix Profitability Problems?
No. Accurate estimating reduces risk at the start, but without real-time job costing and enforced change-order billing during delivery, even a well-estimated job can lose margin to untracked scope changes and delayed cost data.
Recommended
- Contractor Business Consulting Mistakes to Avoid in 2026
- Build an Estimating Checklist for General Contractor Projects
- Contractor Business Assessment Explained for Contractors
- How to Build a Repeat Client Base as a General Contractor
Running the job and the business at the same time? One short email a week — change orders, billing, job costing, scheduling. Free, no pitch. Subscribe.
Free and unconditional. No call required, no obligation, unsubscribe anytime.