9 Types of Construction Workflow Bottlenecks Killing Schedules
Every delayed project traces back to one of nine recurring choke points. Types of construction workflow bottlenecks fall into physical capacity limits, information and approval delays, material and procurement gaps, labor and skills shortages, site congestion, process and administrative friction, quality and rework cycles, and disconnected technology. Each one carries its own signature cost.
- Physical capacity (single crane, limited hoist, tight access): stalls every downstream trade waiting on that resource.
- Information/decision delays (RFIs, submittals, slow approvals): adds days or weeks of dead time to the schedule.
- Material/procurement delays (long-lead items, stockouts): triggers resequencing and idle crews.
- Labor/skills shortages: forces overtime, rushed work, or task deferral.
- Site layout and congestion: eats productive hours through excess walking and waiting.
- Process/administrative delays (change orders, payment holds): freezes decisions that depend on sign-off.
- Quality and rework: reopens finished work and blocks the next trade in sequence.
- Disconnected tech/data: causes crews to work from outdated drawings.
Detection and fixes for each type follow below.
Key Takeaways
Construction workflow bottlenecks form in seven or eight recurring patterns, and lean detection methods like VSM and LBWS find them faster than guesswork does.
| Point | Details |
|---|---|
| Nine bottleneck types repeat | Physical, information, materials, labor, site congestion, process, quality, and tech gaps cause most delays. |
| Waiting and defects cost the most | Non-value-adding activity research ranks these two categories above excess motion or overproduction. |
| LBWS and VSM find problems fast | Structured observation and process mapping surface congestion and approval delays within one to two weeks. |
| Measure before you buy software | Fixing ownership and process first prevents dashboards from just automating a broken workflow. |
| R Construction Solutions LLC runs targeted pilots | Two to six week engagements measure one flow, then fix the highest-impact bottleneck first. |
Table of Contents
- Types of Construction Workflow Bottlenecks: Causes and Real Impact
- How to Detect Bottlenecks: Process Mapping, LBWS, and KPIs
- How to Reduce and Prevent Workflow Bottlenecks
- Getting Ready for a Process-Improvement Engagement
- Sources
Types of Construction Workflow Bottlenecks: Causes and Real Impact
Recognizing a bottleneck fast is half the battle. Here’s what each type actually looks like on a jobsite, and how much schedule and cost damage it tends to cause before someone notices.
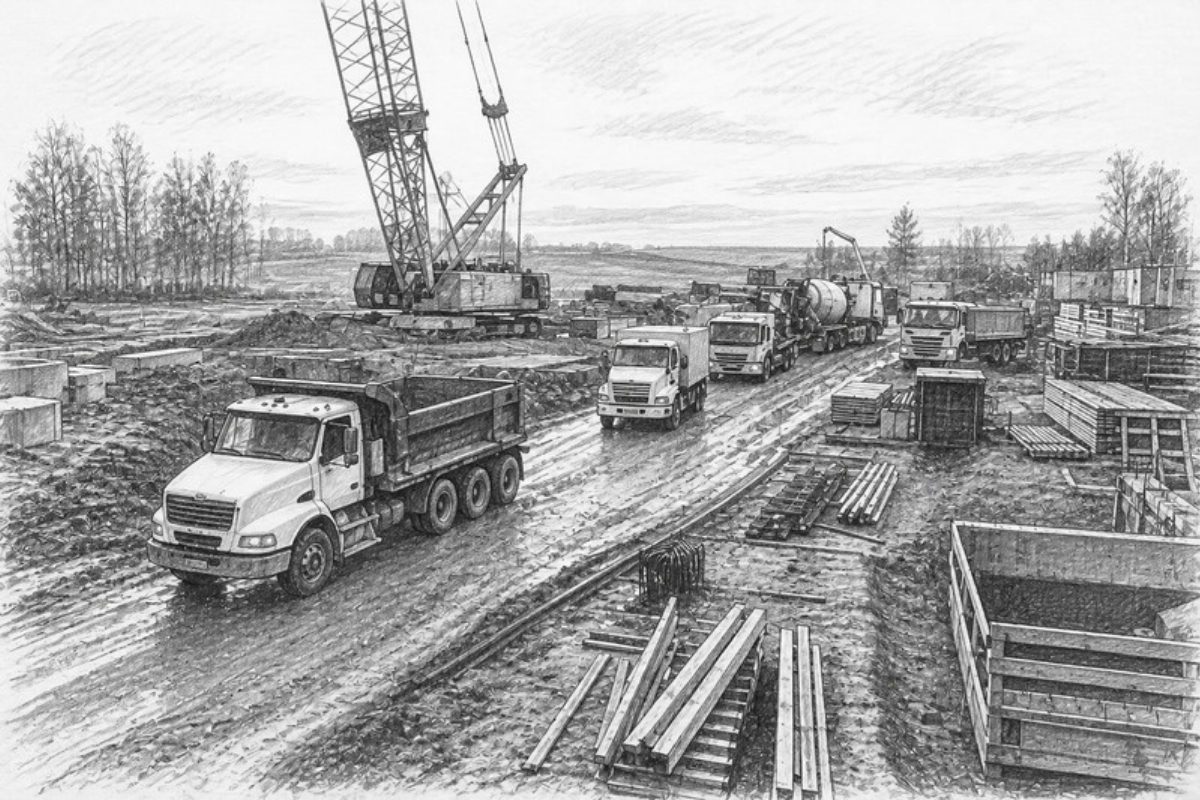
1. Physical capacity constraints. A single tower crane serving four trades, one hoist for an 18-story building, or a loading dock that can only accept one truck at a time. These bottlenecks are visible but often accepted as “just how it is.” The domino effect is predictable: framing waits on steel, MEP rough-in waits on framing, and the whole schedule compresses into a bottleneck queue.
2. Information and decision delays. RFIs sitting on a designer’s desk for 12 business days when the contract calls for 5. Submittal backlogs stacking up because one reviewer handles every package. Once RFI turnaround crosses roughly two weeks, crews start working around unresolved questions instead of waiting, and that’s when rework risk climbs.
3. Material and procurement delays. Long-lead items like switchgear, curtain wall systems, or specialty fixtures ordered late because nobody flagged the lead time during preconstruction. A single stockout on a critical path item can cascade into weeks of resequencing across multiple trades.
4. Labor and skills shortages. Not enough licensed electricians on a multi-project roster, or crews spread too thin across concurrent jobs. This bottleneck rarely shows up as an empty jobsite. It shows up as slower output, more errors, and quiet overtime creep on the same crew week after week.
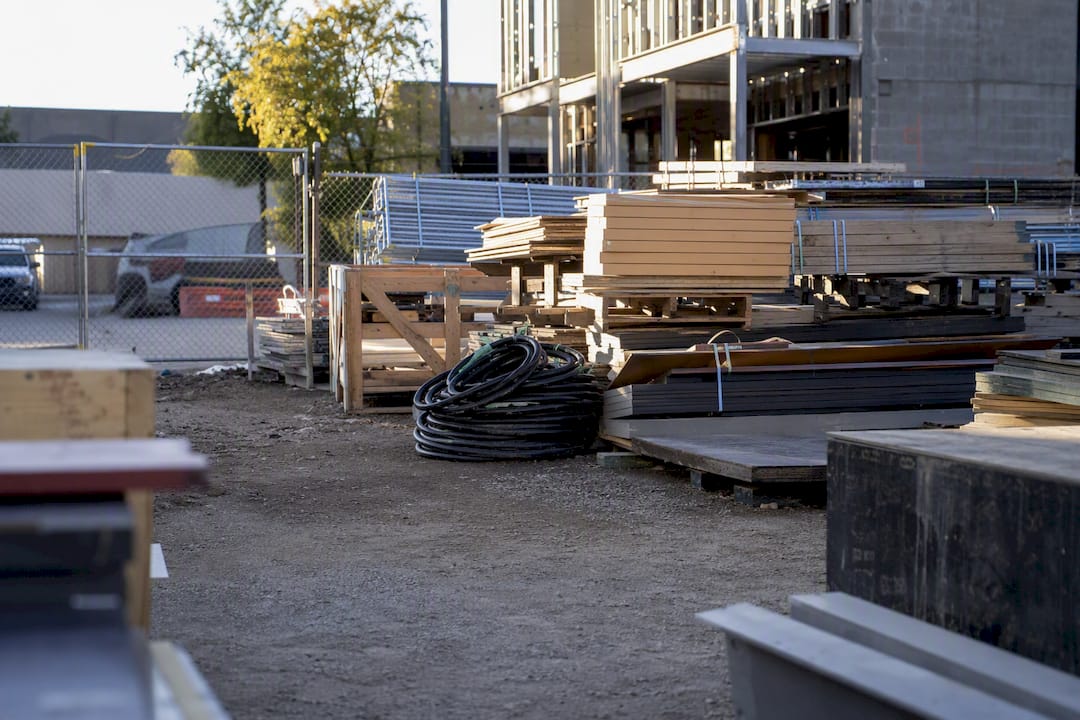
5. Site layout and congestion. Overcrowded staging areas, material laydown blocking access paths, multiple trades competing for the same workspace. Location-Based Work Sampling studies that track worker activity by zone consistently find excessive walking and waiting concentrated in a handful of congested zones, not spread evenly across a site.
6. Process and administrative delays. Change order approval loops that require four signatures before work can proceed. Payment holds that stall subcontractor mobilization. Ambiguous ownership: everyone assumes someone else is tracking the open item.
7. Quality and rework. A failed inspection on rough plumbing blocks drywall, which blocks paint, which blocks flooring. Defects discovered late don’t just cost the rework hours. They block every sequenced task behind them.
8. Technology and data fragmentation. Field crews working from a printed drawing set two revisions old because the cloud folder update never reached the trailer. Duplicate data entry across scheduling software, accounting, and a paper daily log means nobody has one accurate picture.
Research into non-value-adding activities across construction projects consistently ranks waiting and defects as the two costliest categories, ahead of excess motion or overproduction, according to a study on non-value-adding activities. If your crews are standing around or redoing work, you’ve found your two biggest cost leaks before you’ve even opened a spreadsheet.
How to Detect Bottlenecks: Process Mapping, LBWS, and KPIs
You don’t need a six-month audit to find where your workflow breaks. Three methods, used together, surface most bottlenecks within a couple of weeks.
Process mapping (value stream mapping). Map every handoff, wait time, and approval step in a target flow, such as submittal review or excavation sequencing. The output is a current-state map showing where time actually goes, followed by a future-state map showing where it should go. Value stream mapping applied to construction flows has produced cycle time reductions in the 10 to 30 percent range on targeted processes.
Location-Based Work Sampling. A researcher or site lead logs worker activity at intervals: production, preparation, transportation, walking, talking, waiting. A 2025 LBWS study used 994 observations to build activity heat maps that exposed exactly which zones ate the most non-productive time through walking and waiting.
KPIs worth tracking weekly:
- Percent Plan Complete (PPC): the share of weekly commitments actually finished, a core Last Planner System metric.
- Average RFI turnaround time against contract requirements.
- Submittal cycle time from submission to approved return.
- Waiting time per activity, pulled from LBWS or spot observation.
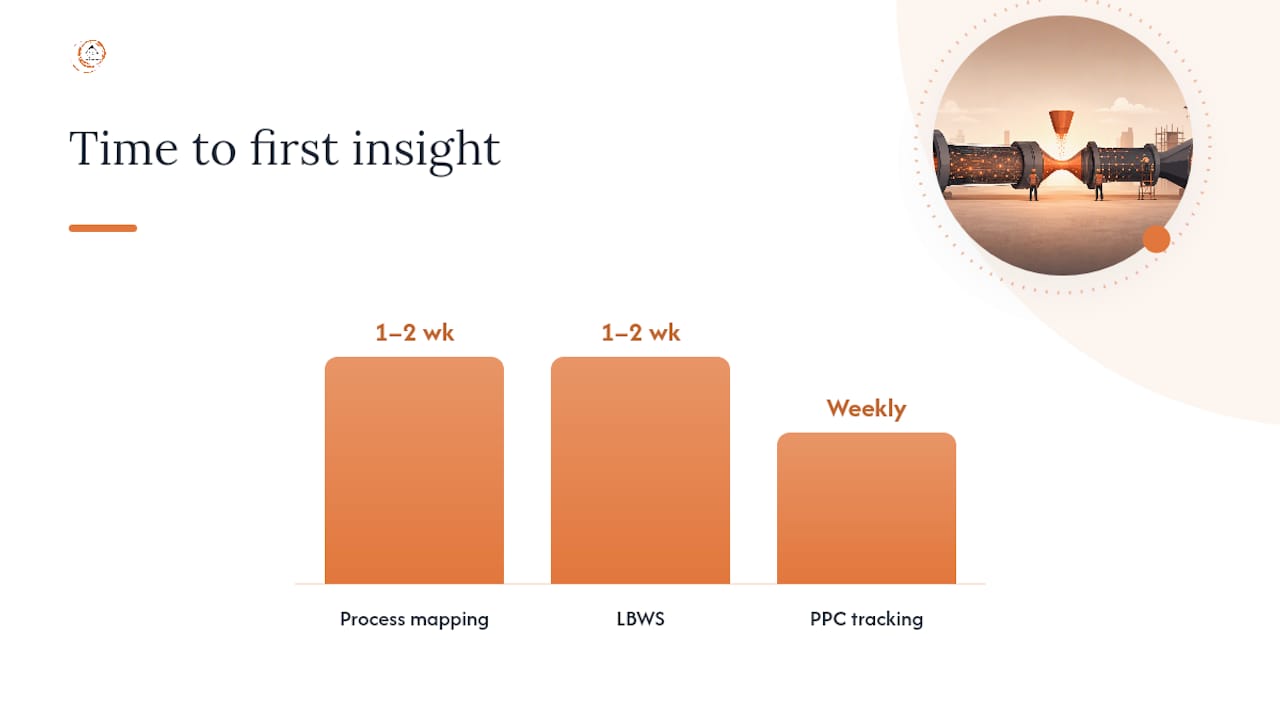
| Method | What it reveals | Time to first insight |
|---|---|---|
| Process mapping / VSM | Handoff delays, approval bottlenecks | 1 to 2 weeks |
| LBWS | Congestion zones, walking/waiting patterns | 1 to 2 weeks of observation |
| PPC tracking | Schedule reliability, recurring constraints | Ongoing, weekly |
Quick diagnostics don’t require formal methodology at all. Watch for inventory piling up in one zone, crews stuck in a “hurry up and wait” pattern, one team logging overtime every week while others don’t, or a backlog sitting on a single desk. The Lean Construction Institute flags these as classic bottleneck symptoms worth investigating immediately.
How to Reduce and Prevent Workflow Bottlenecks
Fixing every bottleneck at once isn’t realistic. Prioritize the one causing the most schedule damage, then work outward.
- Measure first, pilot small. Pick the highest-impact flow, often RFIs or excavation sequencing, and run a two-week baseline measurement before changing anything.
- Run a lean workshop. Use VSM to map the current process with the people who actually do the work, then adopt the Last Planner System for weekly commitment planning. Add an andon-style escalation trigger so blockages get flagged immediately instead of sitting quiet for days.
- Fix ownership before adding tools. Assign a single owner for approvals, bundle deliveries to reduce dock congestion, and use pull planning so trades pull work only when the prior step is genuinely ready.
- Add targeted technology. A single-source dashboard showing RFI and submittal aging beats a full platform overhaul. Automate escalation notices before you automate anything else. Fragmented software rarely fixes a broken process; it just moves the same delay onto a screen.
- Tighten procurement terms. Add supplier performance clauses, order long-lead items during preconstruction instead of after mobilization, and tie payment milestones to delivery performance.
A case study combining lean techniques with digital dashboards on an institutional building project cut excavation activity time by 15 percent and shortened overall project duration by 2.06 percent, simply by eliminating redundant handoffs and waits at the foundation stage.
Pro Tip: Fix the process before you buy the software. A dashboard layered on top of a broken approval chain just gives you a faster view of the same delay.
Getting Ready for a Process-Improvement Engagement
Before bringing in outside help, pull together your schedule baseline, RFI and submittal logs, and a short window of site observation, even informal notes work, covering a week or two.
- RFI log with dates submitted and dates resolved
- Submittal tracker showing review cycle times
- Recent schedule variance reports
- A rough activity log from one or two crews over a short window
R Construction Solutions LLC most often finds quick wins in three places: shortening RFI cycles, standardizing submittal routing so it doesn’t bottleneck through one person, and resequencing excavation and site prep to reduce idle crew time. A typical pilot runs two to six weeks: a measurement phase followed by one focused improvement sprint targeting the single worst-performing flow.
The firms that see the fastest gains aren’t the ones with the biggest budgets. They’re the ones that measure one process honestly, fix it, and only then move to the next.
Why Leadership Has to Own the Fix
Process change sticks only when leadership sponsors it and celebrates small measurable wins first. Fix the process before layering on software, and make sure your client-facing materials reflect the diversity actually working your jobsites.
A Practical Next Step for Contractors Ready to Fix Their Workflow
R Construction Solutions LLC is the direct alternative to guessing your way through a broken schedule. Instead of buying software before diagnosing the actual choke point, our process improvement and workflow optimization engagements start by measuring your real bottleneck, whether that’s RFI cycles, submittal routing, or crew sequencing, and fixing it with targeted, lean-based changes.

Contractors we work with typically see faster approval turnaround, fewer schedule slips tied to unclear ownership, and cleaner handoffs between trades within a single engagement cycle. If your team is doing $1 million to $10 million in annual revenue and has outgrown ad-hoc scheduling fixes, our construction consulting services page outlines how an engagement is structured and what a pilot sprint costs. Reach out to start with a baseline assessment of your worst-performing workflow.
Sources
- Improving construction efficiency through lean techniques and digital tools: case of a real-time implementation in an institutional building construction
- Workflow Issue Identification by Applying Location-based Work Sampling
- How to Detect & Reduce Bottlenecks in Design and Construction