
KPIs in Construction Management: A 2026 Field Guide
Construction KPIs are the vital signs of any project. The Construction Financial Management Association defines them as prioritized indicators that show whether “your business is functioning according to plan,” not just a retrospective look at the financials. For project managers and construction leaders, that distinction changes everything about how you run a job.
KPIs in construction management cover five core domains:
- Financial health: profit margin, Cost Performance Index (CPI), working capital
- Schedule and delivery: Schedule Performance Index (SPI), percent complete, change order rate
- Quality: rework rate, first-time quality, defect rate
- Safety: Total Recordable Incident Rate (TRIR), near-miss rate, Lost Time Injury Frequency Rate (LTIFR)
- Workforce performance: labor productivity, crew turnover rate, submittal turnaround
What makes a metric a KPI rather than just a data point is the “key” part. These are prioritized measures tied directly to project and business goals, not an exhaustive audit of everything you can count. They align stakeholders around shared targets, create accountability at every level, and give you the early warning signals you need to intervene before small issues compound into costly ones.
Why KPIs matter for construction project success
Most construction projects do not fail because of a single catastrophic event. They fail because warning signs went undetected for weeks. Sharing clear, role-based KPIs with teams aligns efforts and improves transparency across complex projects, connecting what field crews see every day with what leadership needs to act on.
KPIs serve as a communication bridge between the field and the office. When a foreman knows the project’s SPI target and sees it slipping, that number creates a shared language for escalating the problem. Without it, the conversation stays informal and the delay compounds.

The importance of KPIs in management also comes down to focus. Tracking too many metrics dilutes accountability. Successful firms concentrate on a core set tied to cost, schedule, and safety, then expand once they have mastered those. That discipline keeps teams from drowning in data and ensures every metric has an owner who acts on it.
Key benefits of well-implemented construction KPIs:
- Early detection: surface schedule slippages and cost overruns while correction is still affordable
- Benchmarking: compare performance across projects and against industry standards
- Resource allocation: identify where labor, equipment, or materials need redeployment
- Accountability: assign clear ownership so metrics drive decisions, not just reports
- Continuous improvement: track trends over time to refine estimating, scheduling, and field execution
What are the core KPI categories every construction manager should track?
KPIs covering financial, project delivery, equipment, safety, and workforce performance form the practical framework for construction project monitoring. Each domain answers a different question about project health.
| KPI | Category | Formula / Measure | What it tells you |
|---|---|---|---|
| Cost Performance Index (CPI) | Financial | Earned Value / Actual Cost | Whether you are over or under budget |
| Schedule Performance Index (SPI) | Schedule | Earned Value / Planned Value | Whether work is ahead or behind plan |
| Rework Rate | Quality | Rework Cost / Total Project Cost | Percentage of work requiring correction |
| First-Time Quality Rate | Quality | Work passing first inspection / Total inspections | Workmanship consistency |
| Total Recordable Incident Rate (TRIR) | Safety | (Recordable incidents x ) / Hours worked | Safety performance vs. industry baseline |
| Near-Miss Rate | Safety | Near-miss events per hours worked | Leading safety signal before incidents occur |
| Labor Productivity | Workforce | Planned labor hours / Actual hours for same scope | Crew efficiency by activity |
| Equipment Utilization | Equipment | Hours in use / Total available hours | How effectively your fleet is deployed |
| MTBF / MTTR | Equipment | Time between failures / Time to repair | Fleet reliability and maintenance responsiveness |
| Change Order Rate | Schedule/Financial | Change orders / Original contract value | Scope control and estimating accuracy |
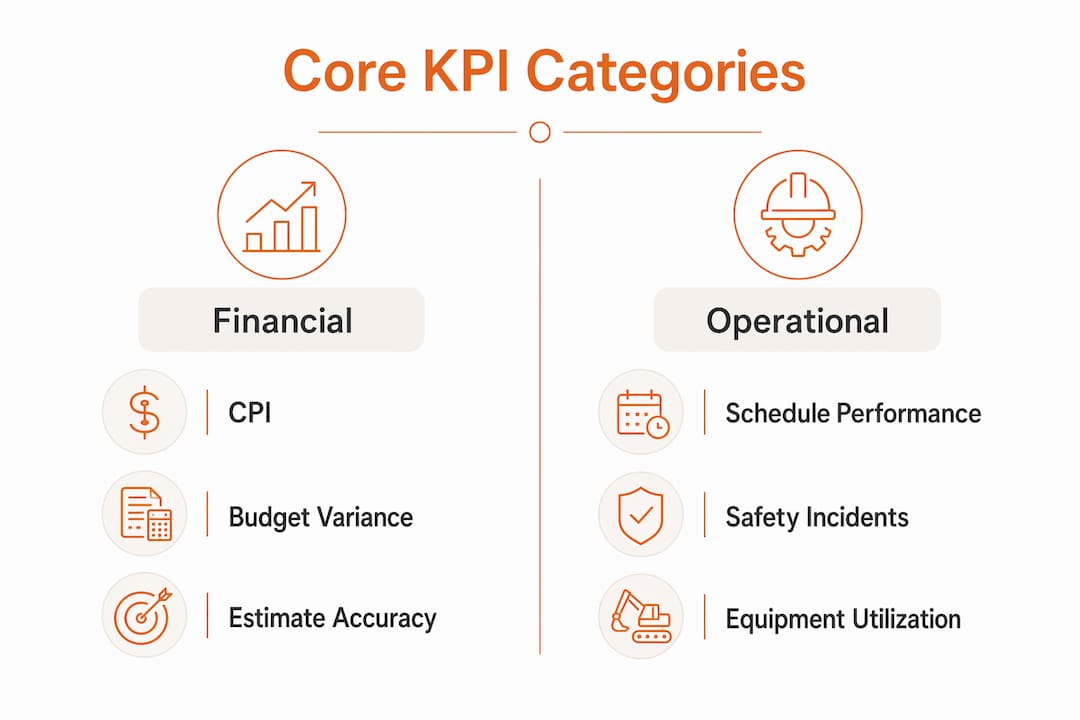
Rework typically accounts for 2 to 6% of total project value and is largely preventable. Tracking rework rate alongside first-time quality gives you both the cost impact and the upstream signal that predicts it. CPI and SPI are the most actionable project-level metrics because they flag problems while you can still intervene, not after the project closes.
Pro Tip: Assign a named owner to every KPI on your dashboard. A metric with no one responsible for acting on it is a vanity measure, not a management tool.
Leading vs. lagging KPIs: how to shift from reactive to predictive
Most construction teams track lagging KPIs by default. Final cost, total incident count, and net profit margin all describe what already happened. They are accurate, but they arrive too late to change the outcome.
Construction managers are shifting toward leading, real-time operational KPIs for early issue identification and preventive action. Leading KPIs signal where the project is heading while you still have time to steer.
Lagging KPIs:
- Report past performance (final cost, incident counts, net margin)
- High data reliability, low intervention value
- Useful for post-project analysis and benchmarking
- Examples: total rework cost, final SPI, LTIFR for a closed project
Leading KPIs:
- Predict near-term outcomes based on current trends
- Require real-time data capture to be useful
- Enable course correction before problems become claims
- Examples: daily installation pace vs. schedule, RFI response time, near-miss frequency, SPI trend over rolling two-week windows
Nearly all North American construction projects exceed their original schedule, which is exactly why SPI as a leading indicator matters so much. A schedule variance identified two weeks after it begins costs far less to correct than one caught at month-end reporting. The shift to predictive measurement requires real-time data, not monthly compiled reports or weekly spreadsheet submissions from crews still on site.
Real-time data integrations from field operations transform lagging financial KPIs into predictive, actionable leading indicators. That transformation depends entirely on data quality at the source.
How to implement KPIs effectively in construction projects
Effective implementation starts with alignment, not software. Before you build a dashboard, you need to know which project goals each KPI serves and who is responsible for acting on it.
Best practices for KPI implementation in construction:
- Align KPIs to project goals and roles. A project manager needs SPI, percent complete, and RFI cycle time. A CFO needs DSO, estimate accuracy, and cash position. Tracking all metrics for all roles creates noise, not clarity.
- Limit your starting set. Successful construction firms focus on a core few — typically cost, schedule, and safety — and expand only once mastery is achieved. Five to eight KPIs with clear owners outperform fifteen tracked without accountability.
- Capture data in real time. A KPI built on a superintendent’s recollection of a site walk from two weeks ago functions as an estimate, not a measurement. Real-time capture closes the gap between when a problem starts and when you detect it.
- Integrate KPIs into regular workflows. Weekly review meetings, daily huddles, and monthly reports all need to reference the same metrics. KPIs that live only in a dashboard no one opens do not drive behavior.
- Train your team and assign ownership. Buy-in comes from understanding. When field supervisors know why a metric matters and what action it triggers, they engage with it rather than work around it.
- Avoid punitive use. The most common KPI failure is treating metrics as punitive tools, which causes team members to game numbers rather than improve performance. Transparency and goal alignment prevent this.
For construction managers working to connect process improvement with KPI tracking, the sequence matters: define the goal, select the metric, assign the owner, then build the data capture process around it.
Industry insights on construction KPI application
The most compelling case for construction KPIs comes from practitioners who have used them to catch problems early and protect margins.
Heather Soderquist, VP of Construction Innovation at Jacobsen Construction, put it directly:
That framing, KPIs as an alert system rather than a reporting exercise, reflects how high-performing construction firms actually use these metrics. The goal is not a clean dashboard at month-end. It is an early warning that triggers a conversation and a decision while the project still has room to recover.
Industry practitioners also point to benchmarking as an underused benefit. When you track win rate, accident frequency rate, and labor productivity consistently, you can compare performance across your own projects and ask the right question: what does good look like, and how do we close the gap?
The fencing project management sector offers a parallel example: firms that adopted structured KPI tracking for schedule adherence and safety reporting reduced project failures measurably, reinforcing that the discipline applies across construction specialties, not just large commercial builds.
Pro Tip: Start your KPI review meetings by asking “What action does this number require?” rather than “What does this number mean?” That shift moves your team from reporting to managing.
How to collect accurate KPI data from the field
Data quality is where most KPI programs break down. Up to 60% of site events communicated informally never get recorded, which means the metrics feeding your dashboard carry a built-in accuracy gap.
The root cause is structural. Field exceptions travel through radio calls, messaging apps, and verbal shift handovers. Structured systems like ERP platforms and project management tools only record what gets entered into them. The mechanic who radios in a breakdown does not then log a work order. The foreman who calls in a near-miss does not file a safety report. These events drive your most important KPIs and remain invisible to every system you currently have.
Practical methods for improving KPI data accuracy:
- Automate field data capture. Automated field data collection converts informal field communications into structured operational records without requiring additional forms or behavior change from field crews.
- Standardize reporting formats. Consistent daily logs, shift reports, and inspection checklists reduce the variation that makes KPI comparisons unreliable across projects.
- Reduce manual transcription. Every handoff between a field event and a system entry is a point where accuracy degrades. Capturing events at the source removes that translation layer.
- Conduct regular data audits. Compare what your KPI dashboard shows against what field supervisors report in weekly meetings. Persistent gaps reveal where your capture process is failing.
- Use mobile-first tools. Field crews are more likely to log events when the interface is fast and accessible from the device they already carry.
The operations with the most reliable construction KPIs are not running the most sophisticated analytics tools. They are running the most complete data capture processes. Clean, complete field data is the foundation everything else depends on.
Using KPIs to drive continuous improvement on every project
KPIs do more than measure the current project. Used consistently, they build the institutional knowledge that makes every future project more predictable.
When you track estimate accuracy across multiple jobs, patterns emerge. If your labor productivity KPI consistently runs 15% below plan on concrete work, that is a signal about your estimating assumptions, your crew composition, or your sequencing, not just a one-time variance. Addressing the root cause improves both the current project and the accuracy of every future bid.
Continuous improvement through KPIs works through a straightforward cycle. Measure performance against a target. Identify the gap. Investigate the cause. Adjust the process or the resource. Measure again. Construction Dive has noted that “measurements help bring standardization and repeatability to processes on a job site,” and that repeatability is what allows firms to predict costs and schedules with increasing confidence over time.
For teams managing coordination across complex projects, KPIs also serve as a coordination tool. When every subcontractor and crew lead references the same schedule performance target, the conversation about delays becomes faster and less contentious. The number creates a shared reality.
The firms that get the most from their KPI programs treat them as living tools, not static reports. They revisit which metrics matter as project phases change, retire KPIs that no longer drive decisions, and add new ones when a recurring problem reveals a measurement gap. That discipline, applied consistently across projects, is what separates firms that grow from those that stay stuck repeating the same costly mistakes.
Key Takeaways
Construction KPIs work only when they are tied to specific goals, owned by named individuals, and fed by accurate, real-time field data.
| Point | Details |
|---|---|
| KPIs as vital signs | The CFMA defines KPIs as prioritized indicators showing whether your business operates according to plan. |
| Focus on a core set | Successful firms start with cost, schedule, and safety KPIs and expand only after mastering those. |
| Lead with leading KPIs | Real-time leading indicators like SPI trends and RFI response time allow intervention before outcomes are locked in. |
| Fix data capture first | Up to 60% of site events never get recorded, making field data accuracy the foundation of reliable KPIs. |
| Avoid punitive use | Teams that see KPIs as punitive tools game the metrics; transparency and goal alignment drive genuine improvement. |
Ready to put your KPIs to work?

Tracking KPIs is one thing. Building the systems, workflows, and team culture that make them drive real results is another. Rconstructionsolutions brings over 30 years of hands-on construction experience to exactly that challenge, helping residential and commercial contractors move from data overload to focused, decision-ready performance measurement.
Whether you are scaling from $5 million to $50 million or tightening margins on complex commercial builds, the team at Rconstructionsolutions can help you identify the right metrics, close your data capture gaps, and build accountability into every project phase.
Explore construction consulting services and see how a structured KPI framework can change what your next project looks like at closeout.